


5 Growth Product Metrics that Every Product Growth Engineer Needs to Know
These metrics can help you speed up your career growth as an product engineer


For the past six years of my professional career, I have only cared so much about the product once I worked in the growth team. This can be harder if you are in a bigger company and easier in a startup environment because engineers are closer to the product and to the metrics.
Today, I am documenting what I have learned about product metrics that appear numerous times during our business meetings every sprint. Product engineers should know these metrics to deliver more impactful work.
Why should all Product engineers in the Growth team need to know product metrics?
If growth is the path that we want to navigate in a dark forest, then metrics will be its compass to guide and illuminate us to the correct path.
Metrics have been the core for making data-driven decisions. All teams should know about metrics to know if they have succeeded.
It's important for engineers to understand metrics in order to create a system that aligns with the experimentation of a feature. For example, if engineers comprehend the input metrics for a referral program, which drives the output metrics of virality, they can design the system to optimize and iterate on the referral program more quickly. This is because after building the system, it should be easy to add or remove various referral programs and prices to get feedback from users faster.
Product engineers who possess a good understanding of product metrics can use monitoring tools to gather the necessary data required to equip products to make better decisions. For example, if we want to test various referral program systems and determine which ones work best and which ones don't, we need to identify the best indicator of success. This might involve tracking metrics like pricing, shareable clicks, open link clicks, and other relevant metrics. By understanding these metrics, product engineers will be able to develop a system that can gather this data in order to enable products to make data-driven decisions.

I hope you are convinced and want to learn more about the 10 growth metrics that every engineer should be a profound engineer. I'll put a for each metric by correlating the associated growth product metrics to metrics for content publishing.
Engagement Metrics
Engagement metrics measure how actively involved your users are with your product.
High engagement indicates that users find value in your product, which can lead to higher retention rates.
Some engagement metrics are like daily active users (DAU) or monthly active users (MAU). Software engineers can use DAU/MAU ratios to identify features driving engagement or pinpoint areas where users are dropping off. Enhancing these features or addressing issues can increase user engagement and retention.
Daily active users (DAU) and monthly active users (MAU) are the most discussed metrics in the growth category. The metrics provide a clear picture of the product's or service usage and engagement levels over time and help assess the health and growth of that product.
Knowing the terminology is a good first step to being closer to the product. However,
What feature should we experiment with to understand engagement?
For the e-commerce application, we can conduct an experiment on the feature, such as flash sales, and conduct an available variant and a control variant to detect how many daily unique user clicks occur when the flash sale is given on the front page is not given on the front page.
If the e-commerce is an app, we can check the app launch regarding the available and the control variant.
For information products, such as a newsletter or articles, we can conduct experiments on DAU and MAU based on the headline - compelling headlines can directly impact DAU/MAU by attracting more readers to click and engage with hate content daily or monthly - resulting in increasing active users.
Feature usage is another important growth metric in the engagement metric criteria. It is a metric that focuses on user behavior towards a particular product feature instead of the entire app.
Knowing these engagement metrics helps engineers prioritize the high-impact features and refine them or remove the underperforming ones.
My manager told me that the difference between seniors and staff is that staff knows what is a priority when everything comes to them. Usually, when I am unsure about the prioritization, I will ask my manager, who will tell me which task is the most priority. However, if I understand which features are most or least used, this automatically helps with work/task prioritization.
If you want to measure feature usage for writing or newsletter, you can experiment with visual elements in the content. By testing the impact of visual elements (images, videos, infographics) in content, writers can understand which features are most popular and engaging.
Retention Metrics
Retention metrics help measure if the product contains long-term value and stickiness.
It tracks how many users continue to use the product over time after their initial visit or sign-up.
Usually, we measure the percentage of users who return to the app after their first visit. This measures how satisfied they are with our product.
To analyze the retention rate for an e-commerce app, we can see if there are any returning users on the platform.
Engineers can analyze these usage patterns to improve features or fix bugs that can lead to higher retention rates. The result can be a steady growth in the user base and longer lifetime value of customers.
When I was working for a startup trying to find a product-market fit for the feature, our feature was to notify the user if a price had dropped on a certain item.
This feature is free, meaning we cannot determine how much revenue is generated from this feature. So, how do we calculate a "product-market fit" for this feature?
One of the metrics we want to check is the lifetime value of a user (LTV) in our app. We are trying to determine how this feature will increase the future revenue attributed to the user.
Another metric that is often associated with retention metrics is churn rate. The churn rate measures the rate at which customers stop using the product.
If you hit "unsubscribe" to this email list, that will count towards an increased churn rate. (Don't do it, please :) )
If you think about a funnel like a bucket of water. The Daily active users will be the water coming into the bucket. The retention metrics, such as churn rate, will be the leaky hole underneath that bucket.
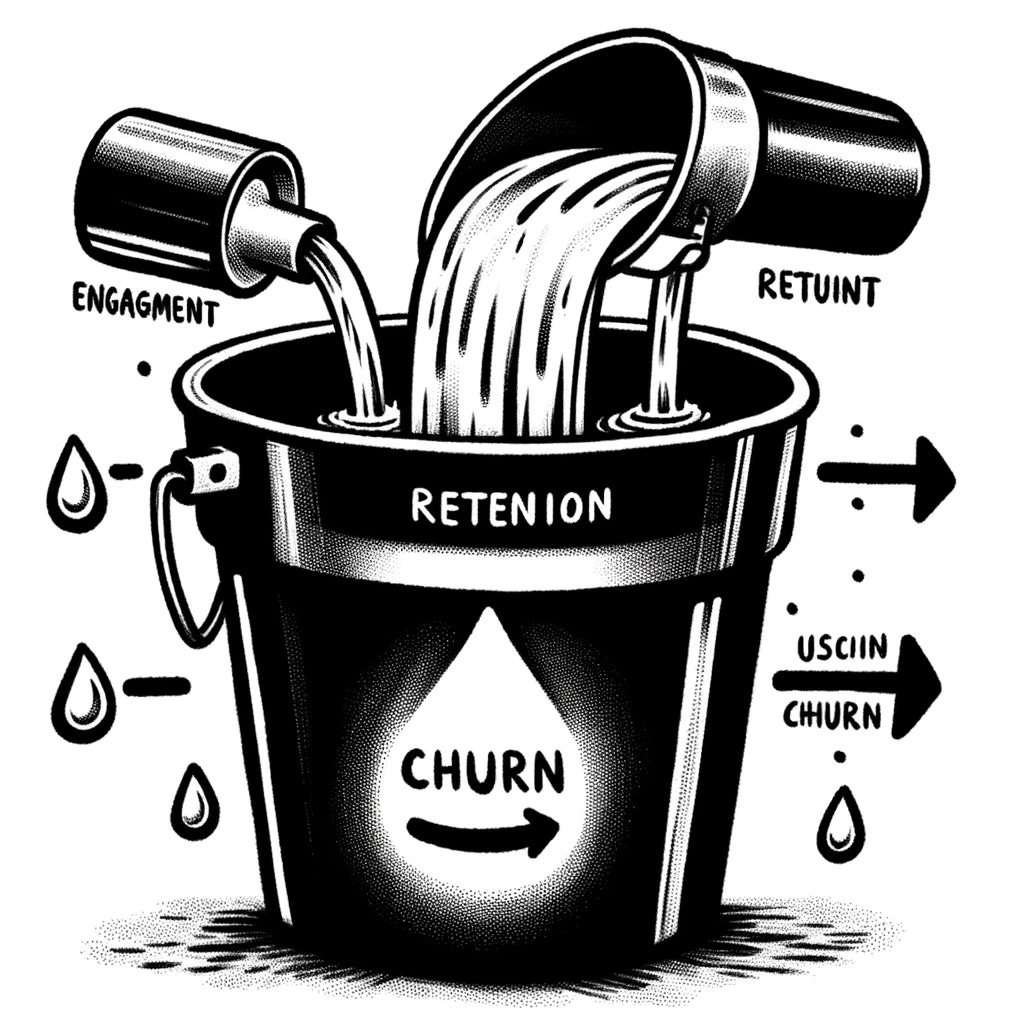
Therefore, if you want to increase the growth of your app, you can do either:
Increase the amount of water poured into the bucket
Decrease the amount of leaks underneath that bucket
So that the overall water level in that bucket will rise up.
By knowing churn rates, you can leverage the data to identify the feature or issue causing users to leave and address the areas to improve overall user satisfaction.
For instance, one way to experiment with churn rate in your product notification is by the frequency of your marketing emails to your users. By adjusting the email frequency, you can determine the ideal frequency sent to the user to not be considered "spammy," which increases the unsubscribe numbers.
Performance Metrics
These metrics are usually engineering metrics.
Typical metrics will be page load times, error rates, uptime..etc.
It measures the technical performance of your product, including speed, reliability, and user experience aspects that can affect satisfaction and engagement.
Suppose you hear a lot of product or engineering articles from companies like Amazon mentioning how X amount of page load time would increase or decrease sales revenue. In that case, they are measuring the performance metric.
This metric is critical to ensure a smooth user experience. Slow load times can increase bounce rates (users who leave the site after visiting one page) and dissatisfaction.
Another metric that counts as a performance metric is error rate. This metric indicates the application's health by tracking the frequency of user errors.
I don't think I need to explain these metrics too much, as this often appears when we are designing our systems.
One note about this feature is that regular monitoring and optimizing code, leveraging coaching, and reducing server response times can significantly improve these metrics.
Conversion Metrics
Conversion metric measures the rate users take a desired action within your product, such as signing up, purchasing, or upgrading their service tier.
It is a key to understanding the product's effectiveness in motivating users to complete goals.
As a software engineer, we can create A/B testing of different features or user flows to directly influence the product's conversion rate.
We usually check conversion by testing AB on a control and available variant. We also check how many users will purchase or upgrade the product based on interacting with that feature.
We can see the conversation rate by experimenting with call-to-action (CTA) placement and wording for marketing tools such as sending out notifications. Place the CTA within different parts of the content and see if new readers can become subscribers.
Customer Satisfaction Metrics
These metrics gauge how satisfied your users are with your product, which can influence all the above metrics, such as retention, word-of-mouth referrals, and overall brand perception.
One thing to understand in this metric is how often your users share your application. Another is calculating how quickly we can troubleshoot user problems in the customer service line.
I often use these metrics to analyze the feedback associated with the user and use that feedback as a new addition to the feature in our next OKR. This feedback is usually feedback that matters the most to the users, and thus, generating our goal based on user feedback will also enhance their loyalty to the brand.
For content creators, play around with content topics and themes to see which will resonate with your reader's satisfaction and willingness to recommend the content to their friends.
Conclusion
Diving into the world of product metrics will shift from development-focused to user-centric development. These metrics are data points that usually come from a product ask. Before understanding these metrics, it was just a mere data point of calling the `tracker` function call to the metrics service. However, by understanding the definition of these metrics, I realized that they are the essence of our product's story.
Now, back to you, are there any specific product metrics I miss? Do you have any tips for other fellow engineers or myself on how to dive deep and understand more about these metrics? Please comment them down below and share them with me :)